Nonmathematical Introduction
after Section 1.1 from [3]
Every day of our lives we experience changes
that occur either gradually or suddenly. We often characterize
these changes as quantitative or qualitative,
respectively. For example, consider the following
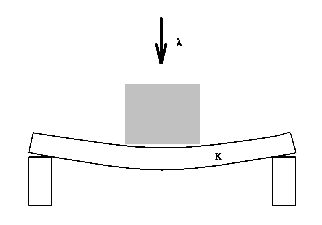
simple experiment (Figure 1).
Imagine a board supported at both ends,
with a load on top. If the load  is small enough, the
board will take a bent shape with a deformation depending on the
magnitude of
  and on the board's material properties (such as
stiffness, K).
This state of the board will remain stable in the sense that a
small variation in the load
  (or in the stiffness
K) leads to a
state that is only slightly perturbed. Such a variation (described by
Hooke's law) would be referred to as a quantitative change. The board
is deformed within its elastic regime and will return to its original
shape when the perturbation in
  is removed.
Figure 1. Bending of a board.
The situation changes abruptly when the load
 is increased
beyond a certain critical level
  at which
the board breaks
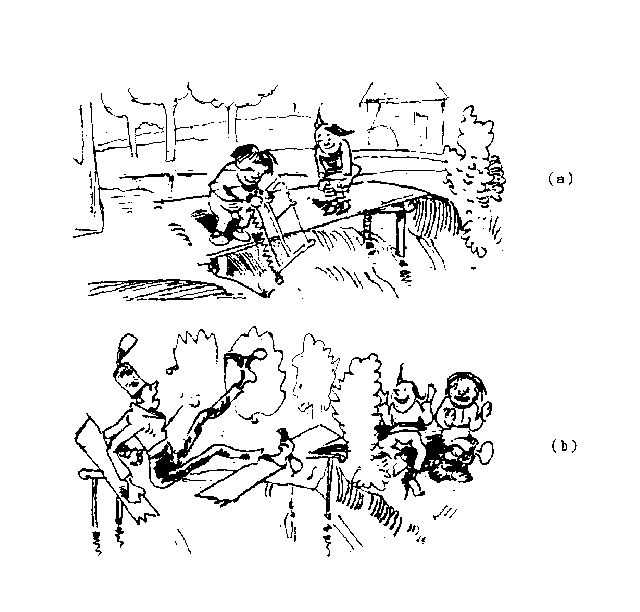
(Figure 2b). This sudden action is an example of a qualitative change;
it will also take place when the material properties are changed
beyond a certain limit (see Figure 2a).
Suppose the shape of the
board is modeled by some function (solution of an equation).
Loosely speaking, we may say that there is a solution for load
values
 and that this solution ceases to exist
for
 .
The load
  and stiffness K are examples of
parameters. The
outcome of any experiment, any event, and any construction is controlled
by parameters. The practical problem is to control the state of a system--that is, to find parameters such that the state fulfills our requirements.
This role of parameters is occasionally emphasized by terms
such as control parameter, or design parameter.
Varying a parameter can result in
a transition from a quantitative change to a qualitative change. The
following pairs of verbs may serve as illustrations:
bend

break
incline

tilt over
stretch

tear
inflate

burst.
Figure 2. From W. Busch [2].
The above-mentioned problems are much too limited
to cover phenomena that we will later want to denote with the
term bifurcation.
The extended range of phenomena we have in mind is indicated
by the pair
stationary state

motion.
Let us mention a few examples. The electric membrane
potential of nerves is stationary as long as the stimulating current
remains below a critical threshold; if this critical value is passed,
the membrane potential begins to oscillate, resulting in nerve
impulses. The motion of a semitrailer is straight for moderate speeds
(assuming the rig is steered straight); if the speed exceeds a
certain critical value, the vehicle tends to sway. Or
take the fluttering of a flag, which will occur only if the
moving air passes fast enough. Similarly, the vibration of tubes
depends on the speed of the internal fluid flow and on the
speed of an outer flow. This type of oscillation also occurs when
obstacles, such as bridges and other high structures, are exposed to
strong winds. Many other examples--too
complex to be listed here--occur in combustion, fluid dynamics,
and geophysics.
Reference will be made to these later in the text.
The transition from a stationary state to motion, and
vice versa, is also a qualitative change. Here, speaking again
in terms of solutions--of governing equations--we have a
different quality of solution on either ``side" of a critical
parameter. Let the parameter in question again be denoted by
 ,
with critical value
  .
Thinking, for instance,
in terms of wind speed,
the state (e.g., of a flag or bridge) is stationary for
 and
oscillatory for
 .
Qualitative changes may come in several steps,
as indicated by the sequence
stationary state
regular motion
irregular motion.
 as branching or
bifurcation. We will use the same symbol
  for various kinds of
parameters. Some examples of parameters are listed in the Table.
Some important features that may change at bifurcations
have already been mentioned. The following list summarizes various
kinds of qualitative changes:
stable

unstable
symmetric

asymmetric
stationary

periodic (regular) motion
regular

irregular
order

chaos.
The quality of solutions or states is also distinguished by their
geometrical shape--that is, by their pattern. For example, the
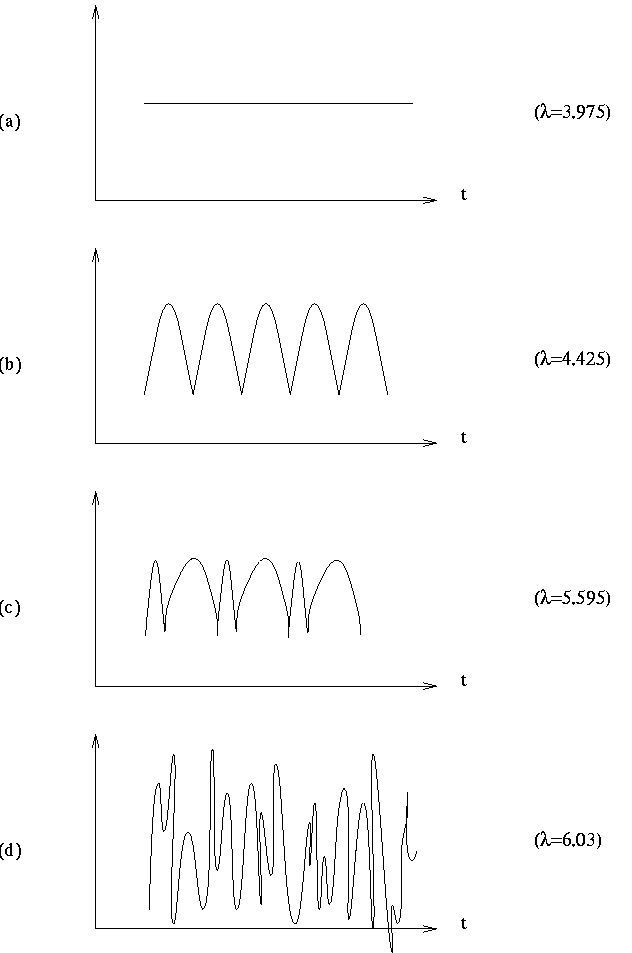
four patterns in Figure 3 characterize four possibilities of how
the velocity of a specific combustion front varies
with time (redrawn after [1]). The solution profile of Figure 3a is
``flat" or stationary; this pattern stands for a uniformly
propagating reaction front. Figure 3b shows a wavy pattern, representing a
regularly pulsating velocity of the combustion front. The pattern of Figure 3c is again wavy but less regular, and the pattern of Figure 3d appears
to be irregular (chaotic). The four different patterns of Figure 3
arise for different values of a parameter  ;
new patterns form when the
parameter passes critical values. This example illustrates why such
bifurcation phenomena are also called pattern formation.
Figure 3. Velocity of a combustion front.
Patterns such as those depicted in Figure 3 are ubiquitous. For instance,
cardiac rhythm or arrhythm is described by similar patterns.
One of the possible patterns may be more desirable than others. Hence, one
faces the problem of how to switch patterns. By means of a proper
external stimulus one can try to give the system a ``kick" such that it
hopefully changes its pattern to a more favorable state. For example, heart
beat can be influenced by electrical stimuli. The difficulties are to
decide how small a stimulus to choose and to set the best time instant
for stimulation. One pattern may be more robust and harder
to disturb
than another pattern that may be highly sensitive and easy to excite.
Before manipulating the transition among patterns, mechanisms of pattern selection must be studied. Which structure is most attractive? Which states are stable? For which values of the parameters is the system most
sensitive?
A Discussion of branching phenomena requires the
language of mathematics. Tutorial 2 will review some important mathematical tools and concepts.
References
[1] Bayliss, A., Matkowsky, B.J.: Two routes to chaos in condensed phase
combustion. SIAM J. Appl. Math. 50 (1990) 437-459
[2] Busch, W.: Max und Moritz. (1865) Facsimile W. Busch Gesellschaft,
Hannover 1962
[3] Seydel, R.: Practical Bifurcation and Stability Analysis. From Equilibrium to Chaos. Second Edition. Springer Interdisciplinary Applied Mathematics 1994
Postscript-File for better printing results:
This Tutorial


